Technology
The UNCRi Framework
At the heart of the UNCRi (Unified Numerical/Categorical Representation and Inference) framework lies a unique data representation scheme coupled with a powerful and flexible inference procedure. The representation scheme treats numerical and categorical variables in a unified fashion and means that a single robust measure can be used to calculate the similarity between any two datapoints, regardless of the mix of variable types or distribution of values. However, these similarities aren’t explicitly computed; instead, they are implicit in the graph-based inference procedure which can estimate the probability distribution of any target variable conditional on the values of one or more other variables.
The framework’s versatility in estimating conditional distributions allows a range of generic data-oriented tasks to be performed. These include prediction (classification and regression), imputation, joint probability estimation and synthetic data generation. However, these out-of-the-box solutions only scratch the surface. The UNCRi framework’s flexibility allows seamless integration of diverse datasets, enabling advanced inferencing for applications like hybrid recommender systems and beyond.
Features of the framework include:
- Unified treatment of data types
UNCRi maps numerical and categorical variables into a unified representation space. This eliminates the need to process and recombine feature types separately, and enables efficient computation of similarities and distances between mixed-type data points. - Single model, multiple tasks
Once built, a single UNCRi model supports regression, classification, missing value imputation, sampling, and more—without requiring separate models for each task. - Flexible distribution modeling
UNCRi can estimate and sample from any conditional or joint distribution, enabling:
• Unconditional and conditional synthetic data generation
• Predictive modeling
• Outlier detection
• Data augmentation - Robust to skew and high cardinality
Effectively handles highly skewed numerical variables and categorical variables ranging from binary to thousands of levels. - Built for missing data
Performs exceptionally well even when large portions of data are missing. Supports integration across heterogeneous datasets with minimal attribute overlap, enabling robust cross-domain modeling and recommender systems. - Efficient and low-maintenance
Being memory-based, UNCRi avoids costly error-reduction training. Model development involves optimizing only a small set of hyperparameters, which are stored as part of the model once determined.
See our Medium article: Graph Data Science for Tabular Data .
What is an UNCRi Model?
An UNCRi model is built on a graph-based representation of the dataset, accompanied by a small set of variable-specific hyperparameters. Creating a model is the essential first step in applying the UNCRi framework to any new dataset. Once constructed, models are typically much smaller than the datasets they represent, particularly for large-scale data. This efficiency is made possible by the use of prototypes — representative points that may not appear in the original dataset but effectively capture its structure. These prototypes preserve inference accuracy while substantially reducing both memory usage and computation time. [Note: Prototypes are not used in the case of Financial Time Series]
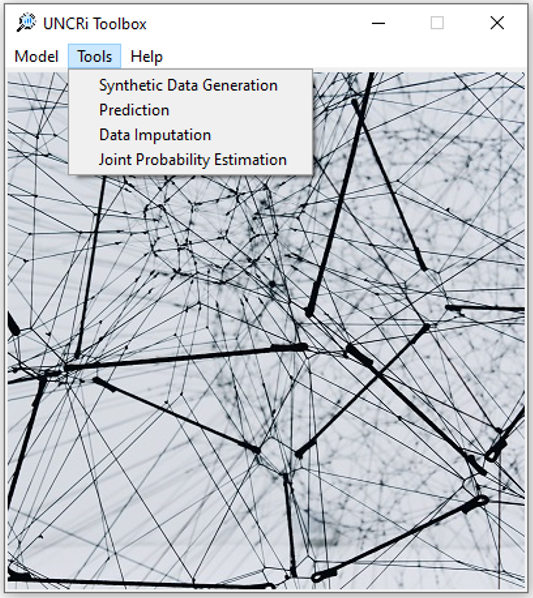
The UNCRi toolbox
The UNCRi toolbox was developed as a convenient GUI-packaged collection of common generic tasks that can be performed under the UNCRi framework. The toolbox can be used to create and save UNCRi data models, and contains tools that can be applied to solving a large variety of important and challenging real-world problems.
Synthetic Data Generation: Create novel data points that are distinct from — yet distributed in the same way as — those in the source dataset. Useful for dataset expansion, augmenting imbalanced datasets, addressing security and privacy concerns, etc.
Prediction: Classification and Regression — predict the most likely value of some missing categorical or numeric variable from the estimated conditional distribution of that variable.
Imputation: Assign a missing value a random value drawn from the variable’s estimated conditional distribution.
- Joint Probability Estimation: Estimates how likely it is that a given data point belongs to the same distribution as the source dataset. This is useful for detecting outliers or generating new data in sparse, low-density regions of the feature space.
Note: The UNCRi Toolbox was created prior to our move into the financial time series sphere. Skanalytix is no longer supporting the UNCRi Toolbox. Thank you to all users for your valuable feedback and advice.
UNCRi for Financial Time Series
The core UNCRi framework can be naturally extended to model financial time series data. This is achieved by augmenting each time-varying variable with additional features representing its past values — typically using a window of 30 lags. The temporal influence of past observations is controlled by a dedicated hyperparameter, allowing for flexible modeling of short- and long-memory dynamics.
This time-aware extension retains all the advantages of the base UNCRi model, including support for mixed data types, missing values, and conditional sampling — making it well-suited for applications such as:
- Scenario-based forecasting
- Synthetic time series generation
- Risk and stress testing
- Macro-financial simulation
- Time-dependent recommender systems
Want to Know More?
For practical examples illustrating UNCRi's broader applicability beyond financial time series, see Introductory demo using the Iris dataset and Synthetic Data Generation on the Adult dataset.