Scenario-Aware Risk Forecasting with Generative Financial Models
Overview
Building on the generative modeling approach from Use Case 1, this case study demonstrates how the Skanalytix financial modeling platform can be used to perform risk assessment for the same portfolio of technology stocks.
Rather than relying solely on historical returns or fixed distributional assumptions, we use the model to generate synthetic data that reflects key empirical features of financial markets, including fat tails, volatility clustering, and evolving cross-asset relationships. This synthetic data provides a basis for estimating portfolio risk metrics such as Value at Risk (VaR) and Conditional VaR (CVaR) across different time horizons and market conditions.
Value at Risk (VaR) for a Correlated Equity Portfolio
Value at Risk (VaR) is a standard measure of downside risk, estimating the potential loss of a portfolio over a given time horizon at a specified confidence level.
In practice, financial returns often violate the assumptions underlying traditional VaR models. Portfolios of correlated equities exhibit heavy tails, volatility clustering, and nonlinear dependencies that are not well captured by models based on normality, independence, or static correlations. As a result, these approaches tend to underestimate risk during periods of market stress and overestimate it during more stable conditions.
At Skanalytix, we address this by modeling the full joint conditional distribution of returns using the Skanalytix financial modeling platform, powered by the proprietary Unified Numerical-Categorical Representation and Inference (UNCRi) framework. The model conditions on recent market behaviour, allowing both volatility and dependence to evolve over time.
By sampling synthetic return paths from this distribution, we obtain empirical estimates of VaR and CVaR that reflect current market conditions rather than long-run averages.
Forecasting Risk from Synthetic Returns
To evaluate how well the synthetic returns capture tail risk, we compare one-day VaR and CVaR forecasts under two contrasting market conditions—high volatility and low volatility—at both the 99% and 95% confidence levels.
The analysis is based on the same four-asset equity portfolio considered in Case 1, comprising Apple (AAPL), Google (GOOG), Meta (META), and Microsoft (MSFT). Historical data spans June 1, 2021 to January 1, 2024, covering both calm and turbulent periods.
Synthetic returns are generated using the Skanalytix simulation engine, which conditions on a rolling window of recent observations. This allows the model to reproduce temporal structure such as volatility clustering and mean reversion, while also preserving cross-asset dependencies.
Thousands of one-day-ahead returns are simulated and used to estimate VaR and CVaR empirically. These are then compared with estimates derived from a normal distribution fitted to the full historical sample.
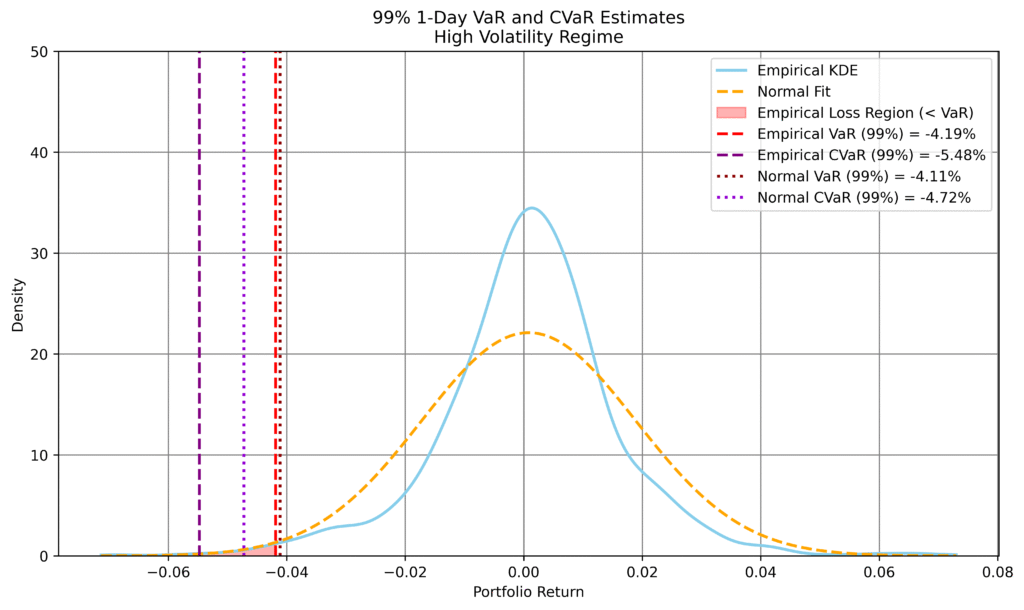
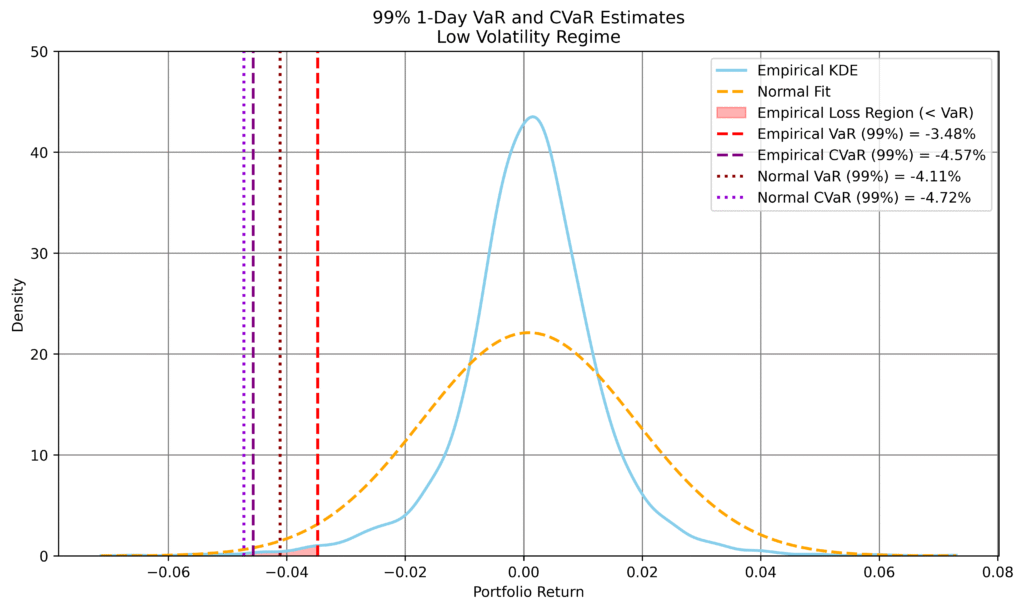
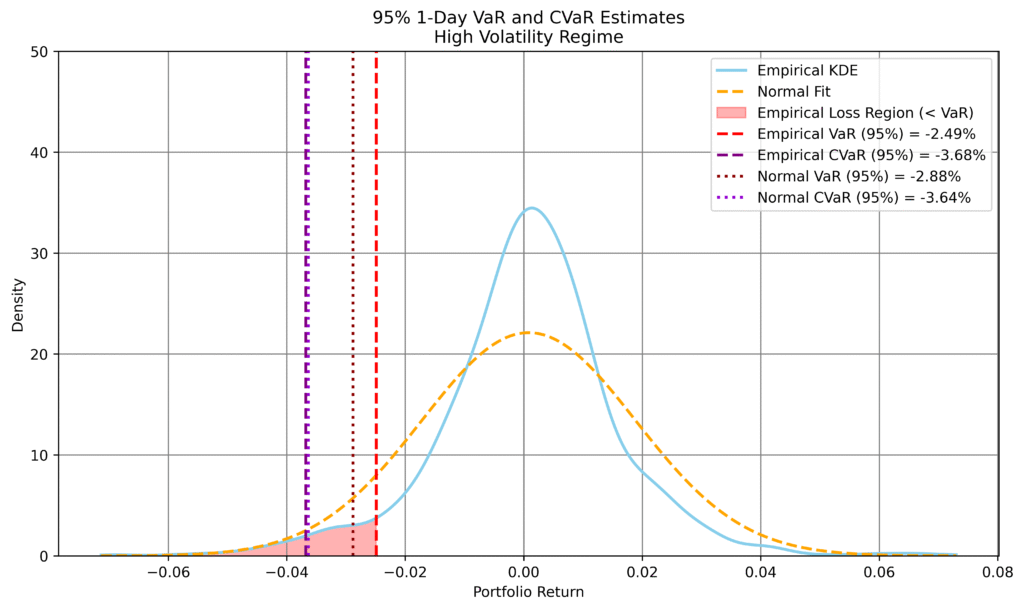
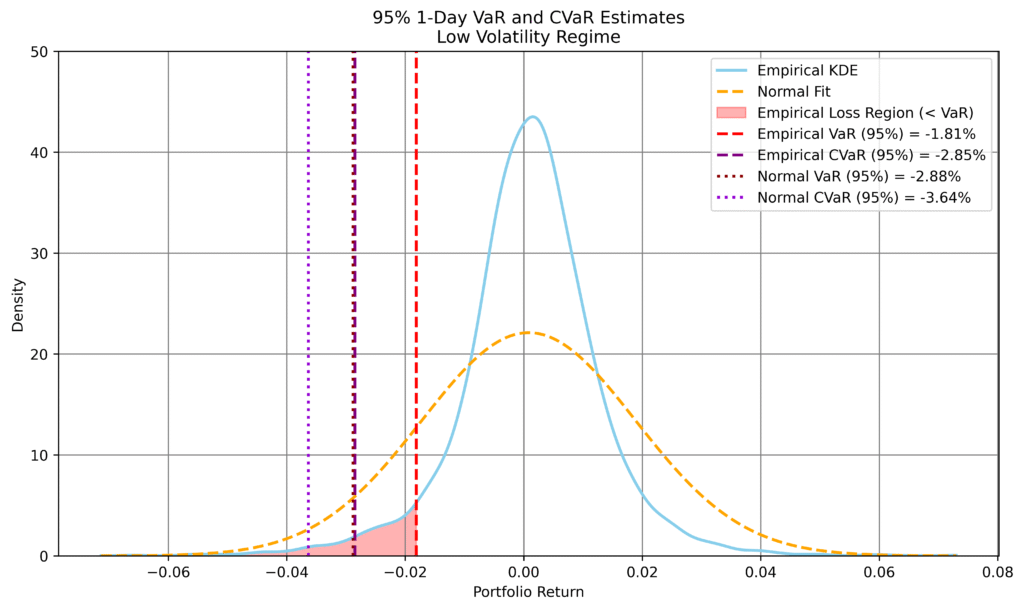
Figure 1: Comparison of empirical and normal-based 1-day VaR and CVaR forecasts across volatility conditions. Left: high volatility; right: low volatility. Top row: 99% level; bottom row: 95%. Empirical estimates are derived from synthetic returns conditioned on recent market behaviour. The normal model uses a single volatility estimate over the full sample.
These results reveal a consistent and revealing pattern:
In high-volatility conditions, the empirical model produces more conservative risk estimates than the normal benchmark, particularly at the 99% level, reflecting heavier tails and increased downside risk.
In low-volatility conditions, the empirical estimates are less negative, indicating that the normal model overstates risk due to its calibration on more turbulent periods.
At the 95% level, differences narrow, but the dependence on current conditions remains evident.
This behaviour highlights a key strength of the generative approach: risk estimates adapt to prevailing market conditions rather than relying on a single static distribution.
Extending Risk Horizons: 10-day and 30-day VaR Forecasts
Extending the risk horizon introduces additional challenges. Over longer periods, compounding effects, volatility persistence, and changing dependence structures make traditional parametric assumptions increasingly unreliable.
To address this, we generate multi-step synthetic return paths and compute 10-day and 30-day VaR and CVaR directly from the resulting empirical distributions.
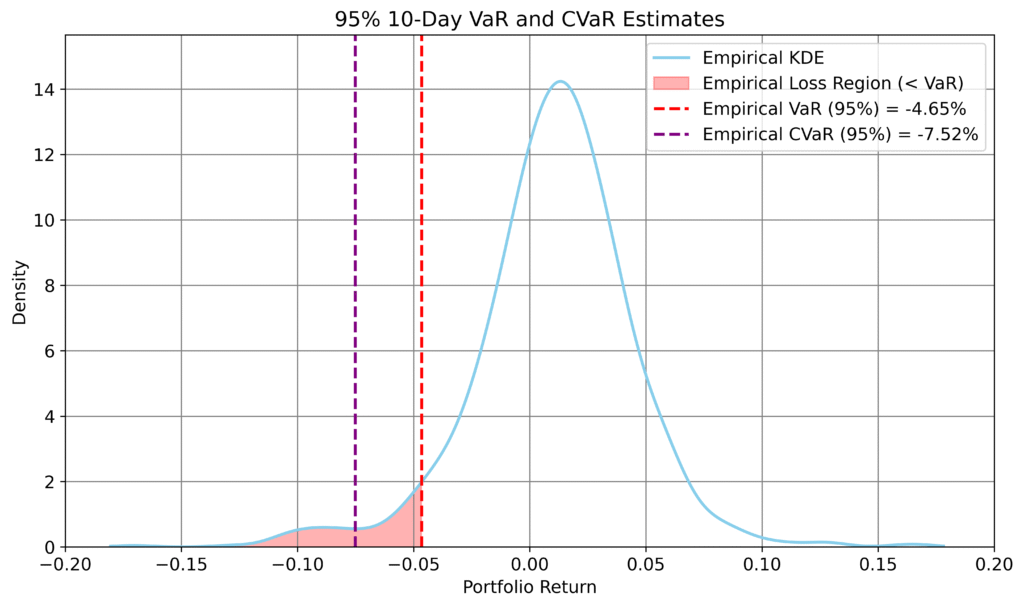
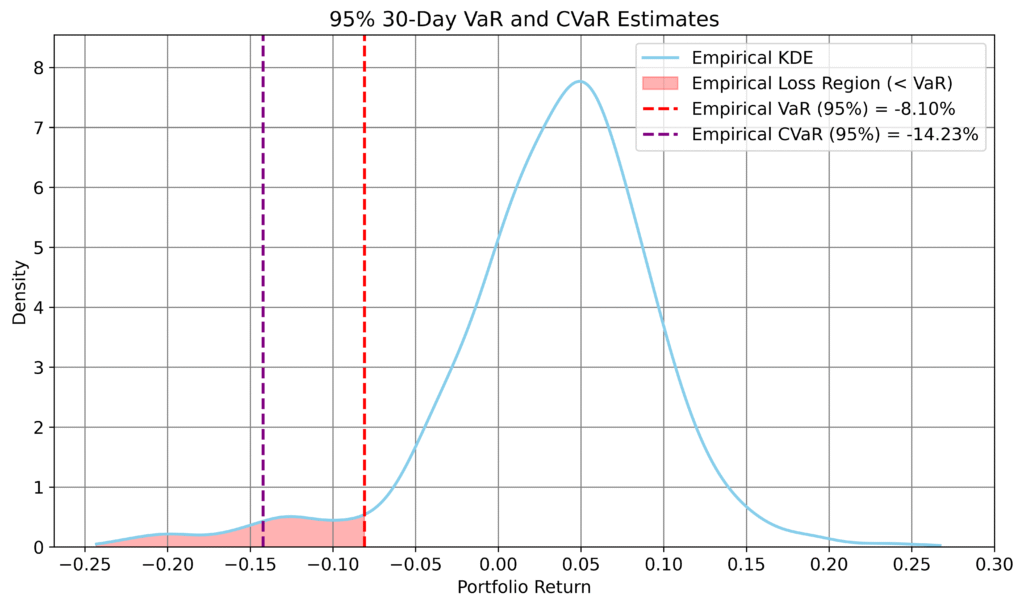
Figure 2: Empirical 10-day and 30-day VaR and CVaR forecasts derived from synthetic return paths.
These longer-horizon distributions exhibit pronounced left tails, particularly over 30 days, reflecting the increased likelihood of large cumulative losses.
Importantly, this behaviour arises not only from individual asset volatility, but from the model’s ability to capture how dependence between assets strengthens under stress. Assets that may appear only weakly related in stable conditions can move together during periods of market disruption, leading to coordinated drawdowns at the portfolio level.
The 30-day distribution also exhibits clear negative skew, with a long left tail and a mean that remains positive due to the upward drift in the underlying data. This asymmetry highlights the limitations of Gaussian assumptions and the importance of modeling both marginal dynamics and joint behaviour.
Summary
This case study demonstrates how the Skanalytix financial modeling platform can be used to generate realistic, path-dependent simulations for portfolio risk assessment.
By modeling the joint conditional distribution of returns and sampling synthetic paths, we obtain VaR and CVaR estimates that adapt to current market conditions and extend naturally across time horizons.
The resulting risk measures reflect not only volatility and tail behaviour, but also the dynamic evolution of dependence between assets—an essential factor in understanding portfolio risk, particularly during periods of market stress.
This provides a more robust and consistent foundation for risk analysis than traditional approaches based on static assumptions or historical replay.