Scenario-Aware Risk Forecasting with Generative Financial Models
Overview
Building on the generative modeling approach from Use Case 1, this case study demonstrates how the Skanalytix financial modeling platform can be used to perform risk assessment for the same portfolio of technology stocks. Instead of relying solely on historical returns or assuming normal distributions, we use our model to produce realistic synthetic data that captures volatility clustering, fat tails, and evolving cross-asset relationships. This synthetic data enables robust estimation of key portfolio risk metrics such as Value at Risk (VaR) and Conditional VaR (CVaR), across varying time horizons and market conditions.
Note: Here, scenario-aware means that future simulated values adapt to recent conditions within the generated path — for example, volatility clustering or trend reversals are reflected as the simulation evolves, rather than assuming independent or identically distributed returns. The term can also be used to refer to conditioning on exogenous variables such as interest rates and inflation. These can be incorporated into the model, but have not been in this case study.
Value at Risk (VaR) for a Correlated Equity Portfolio
Value at Risk (VaR) is a widely used metric that quantifies downside exposure by estimating the worst expected loss over a specified time horizon and confidence level. For instance, a one-day 99% VaR of $10 million means there is a 1% chance of losing more than $10 million in a single day; similarly, a one-day 95% VaR of 3% means there is a 5% chance of losing more than 3% of the portfolio’s value.
However, real financial markets deviate from the assumptions underlying traditional VaR models. Portfolios of correlated equities often exhibit heavy tails, volatility clustering, and nonlinear dependencies that challenge standard VaR calculations. Methods based on assumptions of independence, normality, or static correlations frequently underestimate risk, especially during stress periods. They can also overestimate risks during calm periods.
At Skanalytix, we tackle this by modeling the full joint conditional distribution of returns using the Skanalytix financial modeling platform, powered by our proprietary Unified Numeric/Categorical Representation and Inferencing (UNCRi) framework. This approach learns from historical data to generate probabilistic forecasts that adapt to current market regimes. By sampling synthetic paths from this distribution, we obtain empirical estimates of VaR and Conditional VaR (CVaR) under realistic and dynamic market conditions.
Forecasting Risk from Synthetic Returns
To evaluate how well the synthetic returns capture tail risk, we compare one-day VaR and CVaR forecasts under two market regimes — high volatility and low volatility — at both the 99% and 95% confidence levels.
These forecasts are based on the same four-asset equity portfolio considered in Case 1, comprising Apple (AAPL), Google (GOOG), Meta (META), and Microsoft (MSFT). Historical return data for these stocks spans June 1, 2021, to January 1, 2024, encompassing both calm and turbulent market periods. Synthetic returns are generated using the Skanalytix platform’s simulation engine, which dynamically conditions on a rolling window of past market behavior. This approach captures volatility clustering, mean reversion, fat tails, and other complex temporal dependencies, enabling generation of thousands of realistic values for the one-day ahead return. These values can then be used to produce risk estimates.
In the figures below, we benchmark the empirical risk estimates derived from the synthetic returns against those implied by a normal distribution model fitted to the full historical sample.
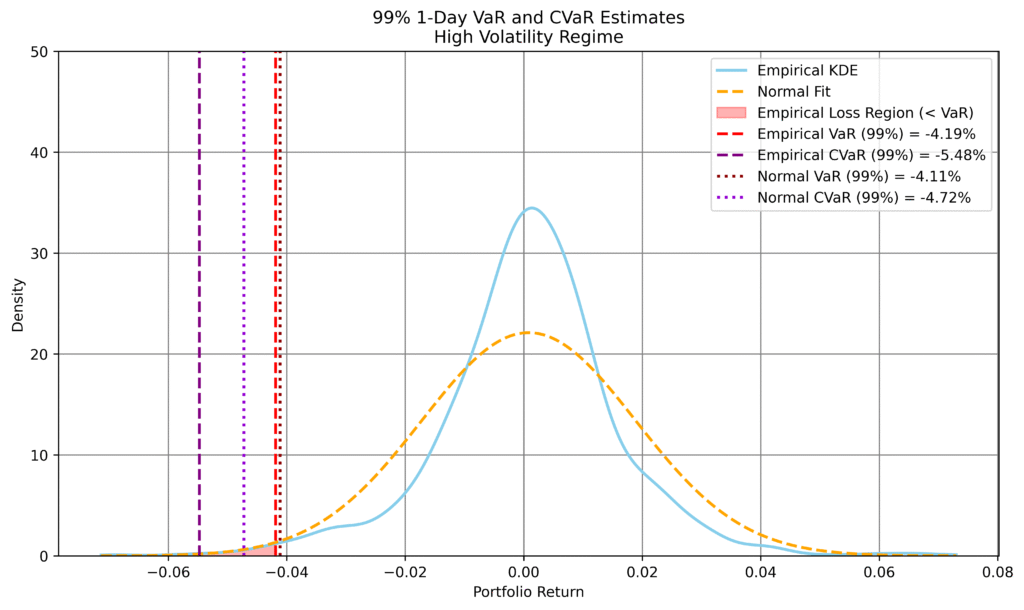
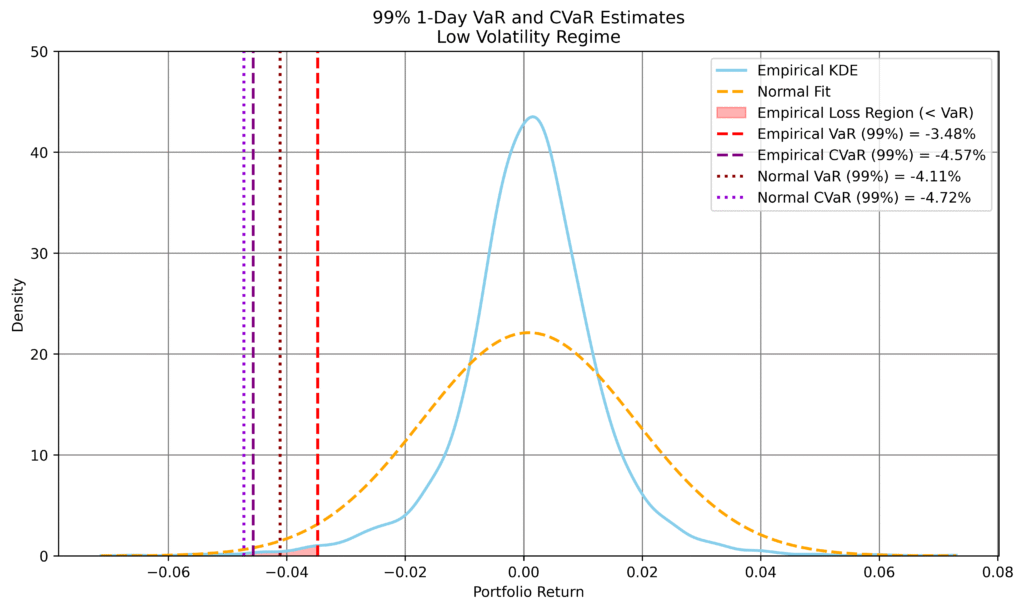
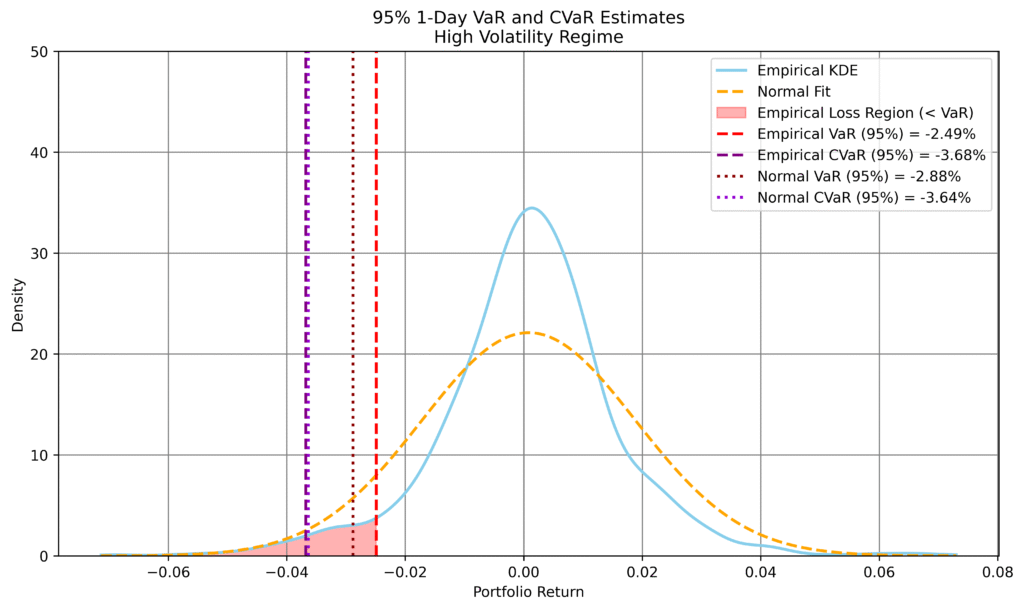
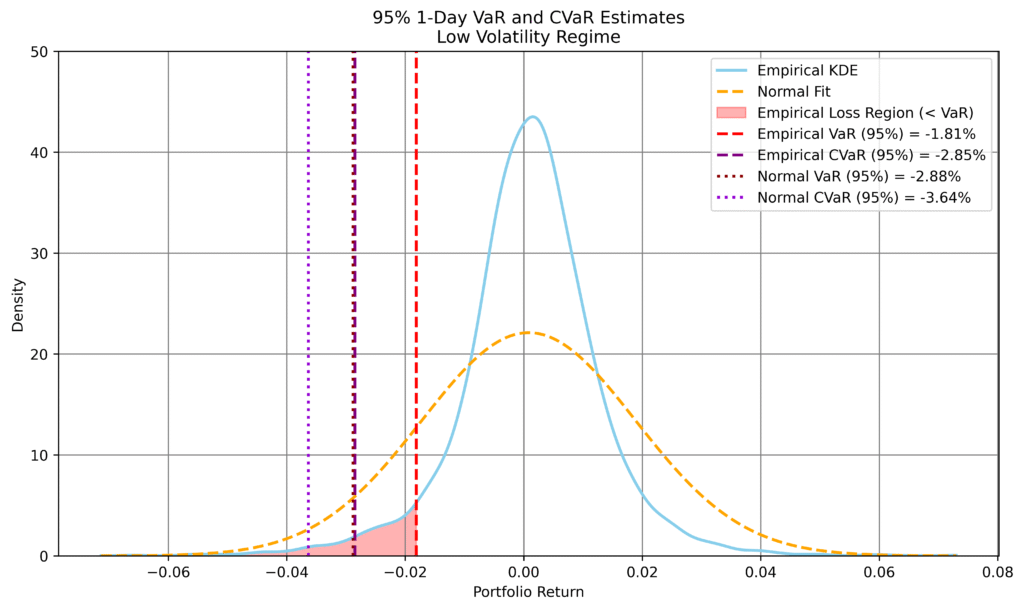
Figure 1: Comparison of empirical and normal-based 1-day VaR and CVaR forecasts across volatility regimes. Left shows high volatility regime; right shows low volatility. Top row shows 99% risk estimates; bottom shows 95%. Empirical forecasts are calculated from synthetic returns conditioned on each regime. The normal model uses a global volatility estimate from the entire historical window.
Note that the empirical KDE is broader (less peaked) in the high-volatility regime than it is in the low-volatility regime. This is because there is a higher probability of larger magnitude returns. The Normal is the same in each case because it was fitted to the same historical data, which contained both turbulent and calm periods.
These results reveal a consistent and revealing pattern:
- In high-volatility regimes (top-left and bottom-left), the empirical model produces more conservative risk forecasts than the normal benchmark — especially at the 99% level — reflecting heavier tails and sharper downside risk.
- In low-volatility regimes (top-right and bottom-right), the empirical estimates are less negative than the normal, meaning that the Normal overstates risk. This is due to it being calibrated on a period that includes significant past market turbulence.
- At the 95% confidence level, differences narrow — particularly for CVaR — but the regime-aware behavior of the empirical model remains evident.
This behavior highlights a major strength of our simulation platform: risk forecasts adapt to prevailing conditions, unlike traditional models that apply a one-size-fits-all distribution regardless of current volatility. By capturing volatility clustering, fat tails, and regime dynamics, our synthetic data enables more realistic and context-sensitive risk assessment that:
- adapts to different volatility regimes;
- more accurately capture tail risks;
- avoids overstating risk in stable markets and understating it in volatile ones.
Extending Risk Horizons: 10-day and 30-day VaR Forecasts
While 1-day VaR estimates are often benchmarked against normal distribution assumptions, extending the horizon introduces new complexities. Over longer periods, compounding effects, volatility persistence, and shifting market regimes challenge the validity of traditional parametric models.
To address this, we extend the simulation horizon and generate 10-day and 30-day synthetic return paths using our learned model. The resulting empirical distributions allow us to compute medium-term VaR and CVaR forecasts without assuming return independence or Gaussianity.
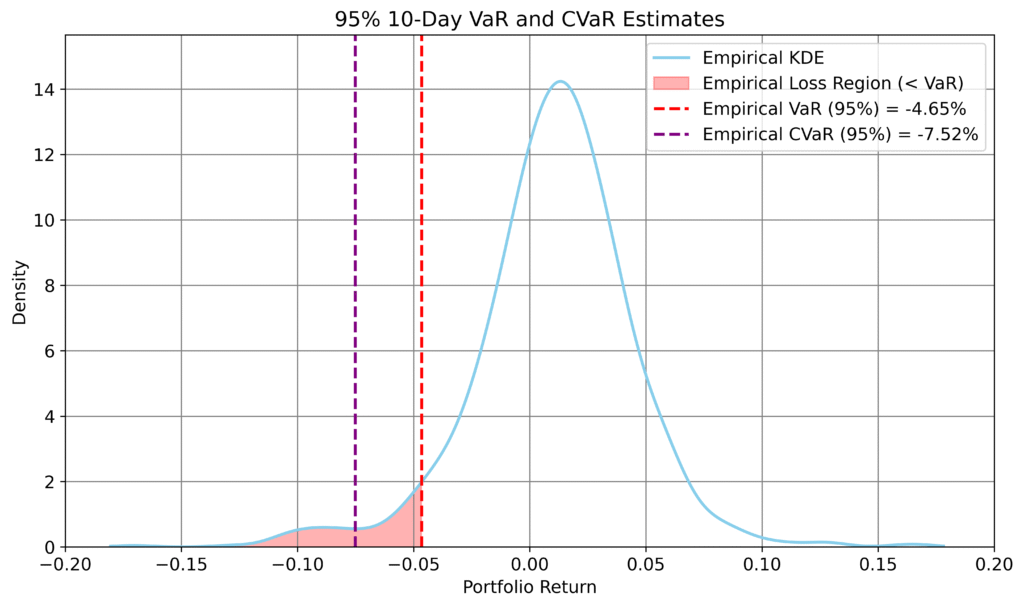
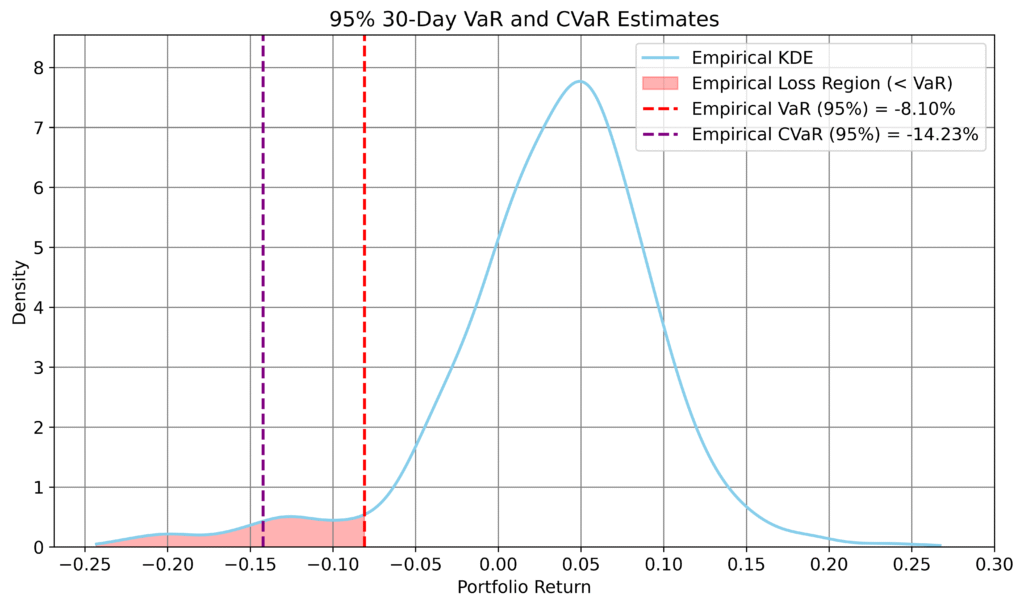
Figure 2: Empirical 10- and 30-day VaR and CVaR forecasts
These distributions exhibit pronounced left tails, especially over 30 days, reflecting the increased likelihood of large losses over extended horizons. This tail risk is not due solely to compounding volatility in individual assets, but to the Skanalytix platform’s ability to capture coordinated drawdowns — a consequence of regime-driven co-movement across equities.
The 30-day return distribution is particularly notable: it shows a clear negative skew, with the mode positioned well to the right of the mean and a long, heavy tail to the left. This shape reflects the increased likelihood of rare but extreme losses — a hallmark of systemic risk — and highlights the failure of Gaussian assumptions to capture such asymmetry. The model reproduces these effects by preserving both asset-level dynamics and the joint evolution of volatility and correlation across assets.
Also to be noted is that the mean return remains positive in both the 10- and 30-day forecasts — a consequence of the upward drift embedded in the historical calibration data. But the skewed and heavy-tailed shape of the distributions reveals an asymmetric risk profile that is amplified over time, especially in turbulent regimes.
Together, these findings highlight how the Skanalytix modeling platform produces realistic, path-dependent forecasts that respect both asset-level dynamics and systemic interactions — a crucial advantage when assessing risk beyond short-term assumptions.
Summary
This case study illustrates how Skanalytix’s generative modeling platform supports scenario-based portfolio risk forecasting. Rather than treating synthetic data as an end in itself, we treat it as a sampled expression of a learned probabilistic model — a model that captures volatility clustering, regime dependence, and realistic joint behavior among assets.
By using this approach, we produce VaR and CVaR estimates that adapt to prevailing market conditions and extend meaningfully across time horizons. The result is a more robust, transparent, and data-consistent foundation for risk analysis — particularly in environments where traditional parametric models fall short.
