
SKANALYTIX INSIGHTS
When Portfolio Dispersion Collapses
Portfolio diversification is often assessed through the correlations between asset returns. When correlations are relatively low, individual assets can contribute different patterns of returns, reducing overall portfolio risk. But these relationships are not constant. During periods of market stress, assets that ordinarily behave quite differently may begin moving together, weakening diversification precisely when it is most needed.
An important question for financial modelling is whether synthetic market data can reproduce this changing dependence structure. Matching average correlations is not sufficient if the simulated assets fail to exhibit periods in which diversification deteriorates sharply.
To investigate this, we examined an equal-weighted portfolio of 30 S&P 500 stocks, comparing historical returns with synthetic returns generated using the Skanalytix model. The objective was to determine whether the synthetic data reproduce the changing relationships between assets, including episodes of pronounced diversification collapse.
Measuring the deterioration of diversification
One way to examine diversification is to track the proportion of asset pairs whose returns have relatively low correlation. For a portfolio of 30 assets, there are 435 distinct pairs. We use a correlation threshold of 0.4 and calculate the fraction of pairs whose rolling correlations fall below this threshold.
When this fraction is high, many asset pairs exhibit relatively weak co-movement. When it declines, a greater proportion of assets are moving together, indicating that diversification is becoming less effective. Although this measure does not directly quantify portfolio risk, it provides a useful view of how the underlying dependence structure evolves.
Importantly, the measure is based on correlations calculated over rolling windows, allowing changes in the relationships between assets to be observed through time.
Evidence from historical returns
Figure 1 shows the historical portfolio from June 2018 to December 2025. The upper panel displays daily portfolio returns, cumulative portfolio value and extreme positive and negative returns. The lower panel shows the fraction of asset pairs with correlations below 0.4.
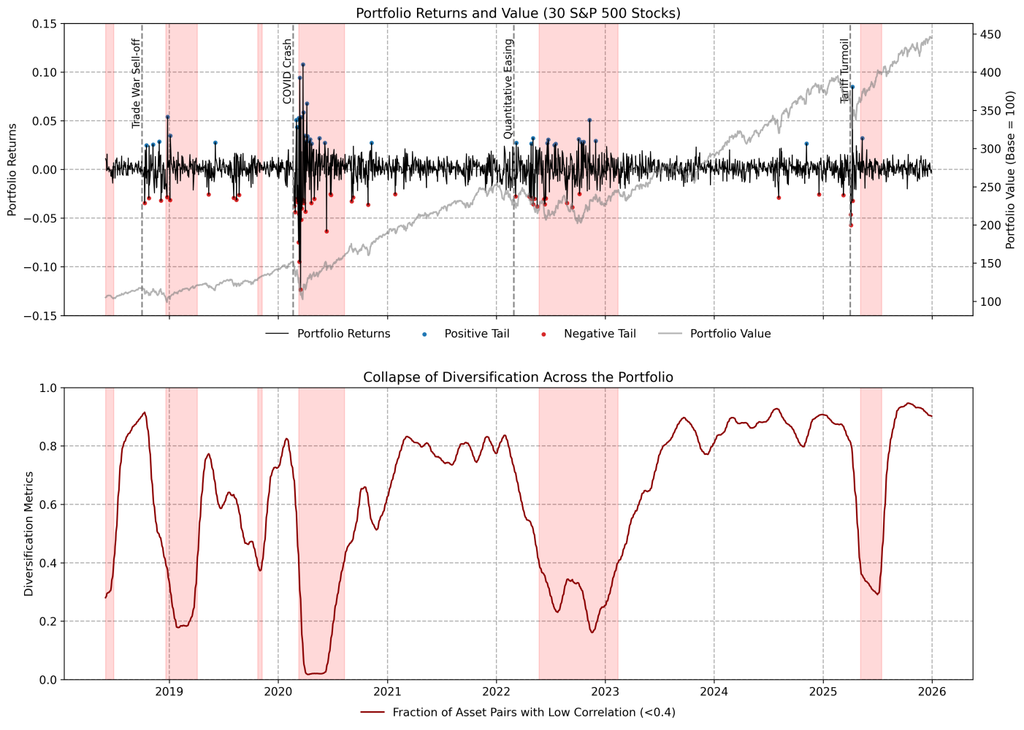
Figure 1. Historical portfolio returns, cumulative portfolio value and the fraction of asset pairs with correlation below 0.4. Shaded regions identify periods of pronounced deterioration in diversification.
The fraction of weakly correlated pairs varies substantially over time. During relatively calm periods, it can remain high, indicating that many assets retain distinct patterns of returns. During episodes of market stress, the fraction can fall sharply as correlations increase across the portfolio.
This behaviour is evident around several significant market episodes, including the 2018 trade-war sell-off, the COVID-19 crash in 2020 and the market turbulence associated with monetary tightening in 2022.
In some cases, the decline in diversification begins before the largest movements in portfolio returns. This raises the possibility that changing correlation structure may provide information about emerging portfolio vulnerability. However, the relationship is not consistent. During the tariff-related turbulence in 2025, the principal volatility surge preceded the sharp deterioration in diversification.
The historical evidence therefore supports interpreting diversification collapse as a feature associated with periods of market stress, rather than as a reliable predictor of when such periods will occur.
Reproducing the behaviour in synthetic data
The next question is whether a generative model can reproduce similar behaviour without explicitly prescribing the timing or magnitude of diversification collapses.
Figure 2 shows a synthetic portfolio generated using the Skanalytix model, with the same 30-asset structure. As in the historical results, the upper panel displays portfolio returns and cumulative value, while the lower panel tracks the fraction of weakly correlated asset pairs.
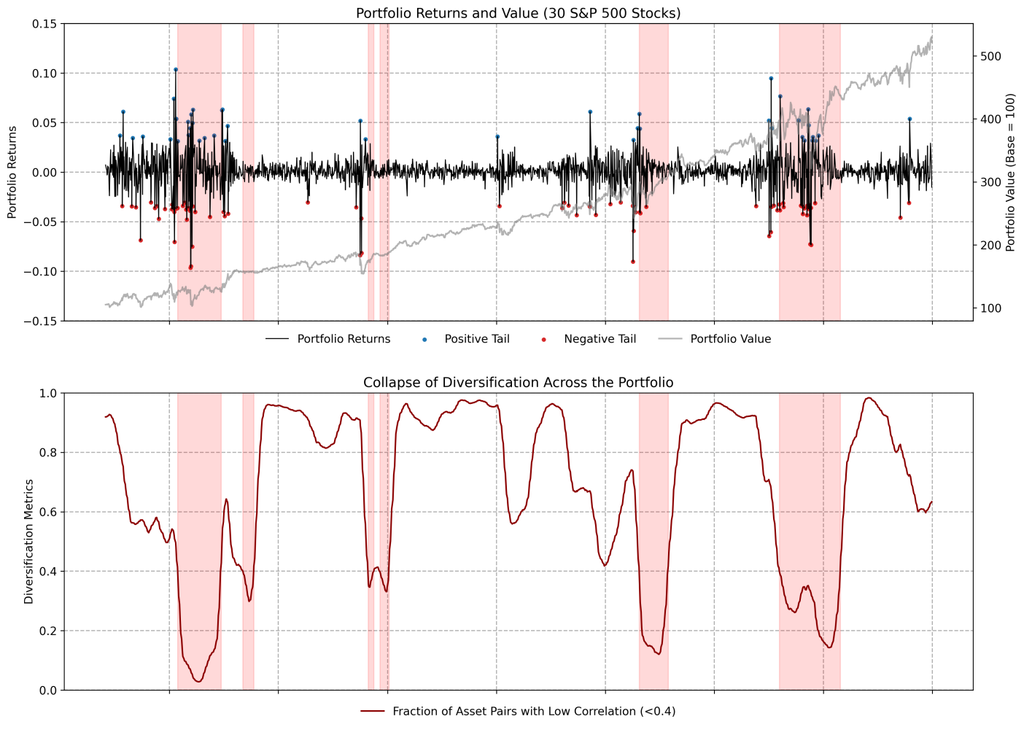
Figure 2. Synthetic portfolio returns, cumulative portfolio value and the fraction of asset pairs with correlation below 0.4. Periods of sharply reduced diversification emerge within the simulated return histories.
The synthetic portfolio exhibits substantial changes in diversification through time. During some periods, most asset pairs remain relatively weakly correlated. At other times, the fraction falls sharply, accompanied by episodes of elevated volatility and more pronounced return movements.
These changes resemble the broad behaviour observed in the historical data, although the timing and duration of individual episodes differ. This distinction is important: the purpose of the simulation is not to reproduce the historical sequence of market events, but to generate alternative plausible histories exhibiting similar statistical and structural properties.
Across the full sample, the mean pairwise correlation was 0.395 in the historical portfolio and 0.388 in the synthetic portfolio. While this agreement is useful, the time-varying behaviour shown in Figures 1 and 2 provides additional information that cannot be captured by a single average correlation.
How correlations change with volatility
The changing fraction of weakly correlated pairs provides a time-based view of diversification. A complementary perspective is to examine the correlation structure directly under different volatility conditions.
For this analysis, portfolio volatility was measured using the 15-day rolling standard deviation of equal-weighted portfolio returns. The lowest 10% and highest 5% of observations were used to identify low- and high-volatility periods, respectively.
Figure 3 shows the pairwise correlation matrices and corresponding distributions for the synthetic portfolio under these two conditions.
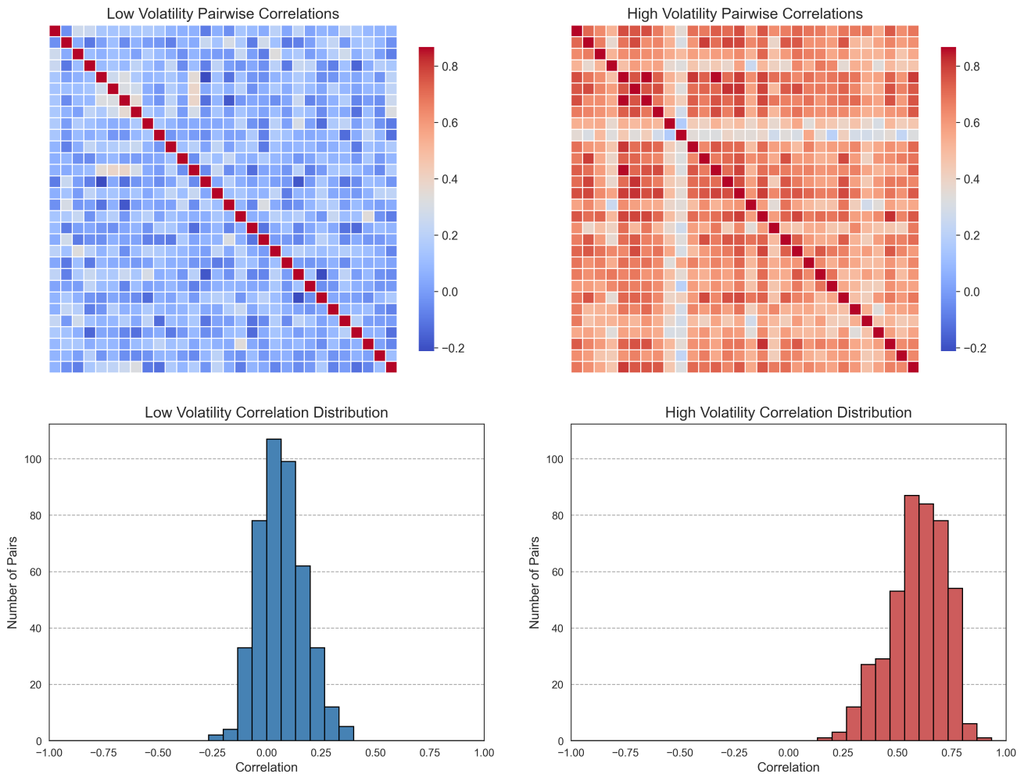
Figure 3. Pairwise correlations in the synthetic portfolio during low- and high-volatility periods. The upper panels show correlation matrices, while the lower panels show the distributions of correlations across asset pairs.
During low-volatility periods, correlations are generally weak and distributed around relatively low values. During high-volatility periods, the distribution shifts substantially towards stronger positive correlations, and the correlation matrix becomes more uniformly positive.
The historical portfolio exhibits a similar change. Mean pairwise correlation increases from 0.084 during low-volatility periods to 0.699 during high-volatility periods. In the synthetic portfolio, the corresponding increase is from 0.068 to 0.592.
The synthetic data therefore reproduce a substantial increase in cross-asset dependence during periods of elevated portfolio volatility, although the increase is less pronounced than in the historical data.
These results provide evidence that the model captures more than the unconditional correlation structure. It also reproduces an important relationship between market volatility and the strength of co-movement across assets.
Implications for scenario analysis
For portfolio risk analysis, the distinction between average correlation and changing correlation structure is consequential. A model may reproduce individual asset return distributions and even match the average correlations between assets, yet still fail to capture episodes in which diversification deteriorates substantially.
Such episodes are important because the benefits of diversification can diminish during periods when portfolio losses are already unusually large. A synthetic scenario generator intended for stress testing should therefore be assessed not only on marginal return distributions and average dependence measures, but also on its ability to reproduce changes in dependence across different market conditions.
The results presented here demonstrate that the Skanalytix model can generate periods of pronounced diversification collapse, together with the associated increase in correlations during high-volatility conditions. They do not establish that the model can forecast when such episodes will occur, nor do they establish the accuracy of any early-warning indicator derived from the simulated data.
Conclusion
Portfolio diversification is not a static property. The relationships between assets can change substantially through time, and periods of elevated volatility are often accompanied by a marked increase in cross-asset correlations.
The historical and synthetic portfolios examined here exhibit similar broad patterns of changing dependence, including episodes in which diversification deteriorates sharply. Reproducing this behaviour is an important consideration when evaluating synthetic financial time series for scenario analysis and stress testing.
The central question is not simply whether a model reproduces average correlations, but whether it captures how the dependence structure evolves as market conditions change.