
SKANALYTIX INSIGHTS
When Extremes Cluster
Extreme financial returns are not distributed evenly through time. Large market movements often occur in periods of sustained turbulence, with unusually large gains and losses appearing close together. This temporal organisation matters for risk analysis: two return series can have similar distributions yet expose a portfolio to very different sequences of losses.
A useful test of synthetic financial data is therefore whether it can reproduce not only extreme returns, but also plausible sequences in which those extremes cluster. The question is not whether a model can predict the next crisis, but whether it can generate alternative market histories that exhibit important characteristics of past periods of stress.
Why the clustering of extremes matters
Fat tails describe the relatively high frequency of large returns compared with a thin-tailed benchmark. Volatility clustering describes the tendency for periods of high and low variability to persist. Clustering of extreme returns is related to both, but it concerns the timing and concentration of unusually large observations. Matching an unconditional return distribution alone does not establish that a simulation reproduces this temporal behaviour.
For portfolio stress testing, the sequence of losses can be as consequential as their individual magnitudes. A series of large losses over a short interval can create very different drawdowns and risk-management pressures from the same observations dispersed across a longer period.
Historical episodes of extreme market behaviour
Historical crises provide examples of how extreme market movements can differ in their magnitude, duration and recovery. The original analysis examines 250-day windows associated with Black Monday in 1987, the Global Financial Crisis and the COVID-19 market shock. These episodes are not interchangeable: they illustrate different ways in which large market movements can unfold.
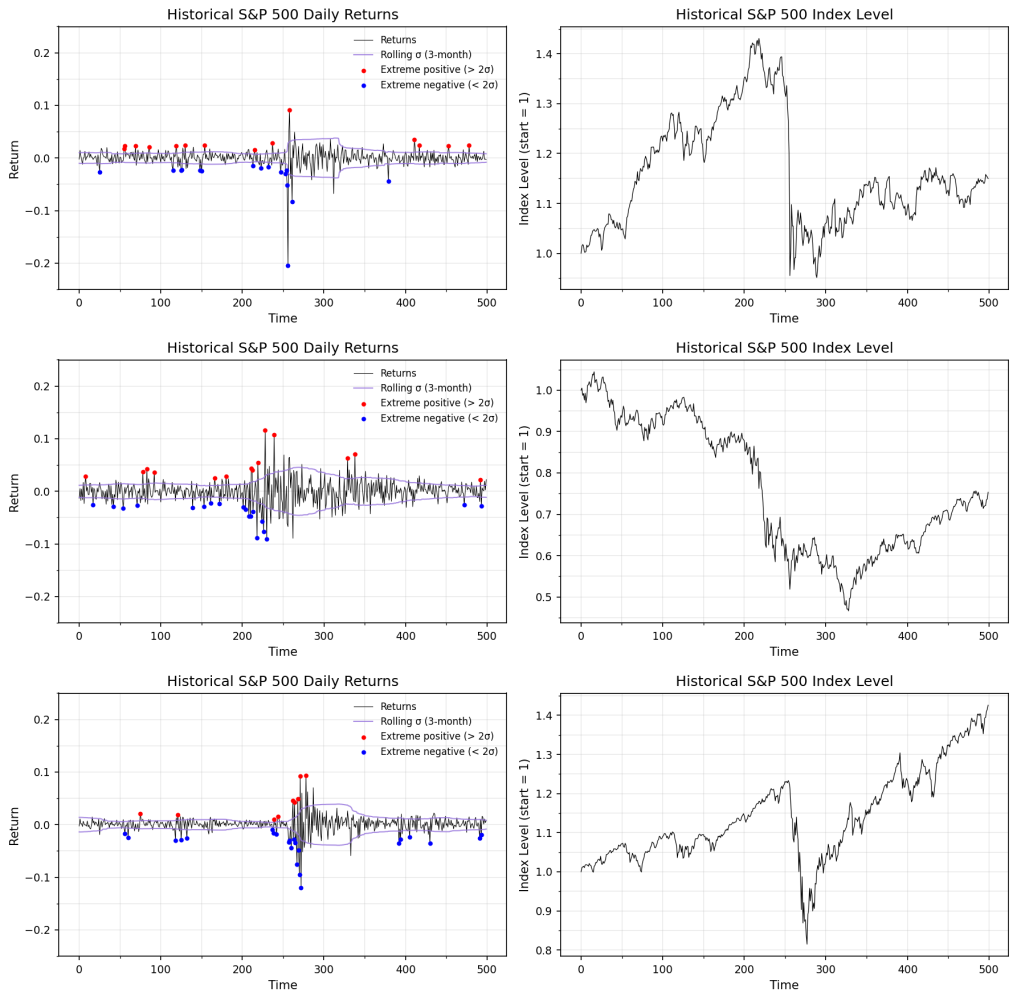
Figure 1. Historical extreme-market episodes shown over comparable 250-day windows: Black Monday 1987, the Global Financial Crisis and COVID-19. Insert the original figure unchanged.
The point of comparing these episodes is not to identify a single crisis template. Rather, it is to illustrate the range of temporal patterns that a useful scenario generator should be capable of representing.
Generating alternative extreme scenarios
The Skanalytix model generates returns sequentially, conditioning each new observation on the evolving simulated history. As a result, the conditions used to generate the next return change as the path develops. This provides a way for periods of turbulence and clusters of extreme movements to emerge within simulated sequences without prescribing a historical crisis date or simply replaying a complete historical episode.
The original analysis presents three synthetic extreme scenarios over comparable 250-day windows. They are examples of alternative paths rather than forecasts of specific future events.
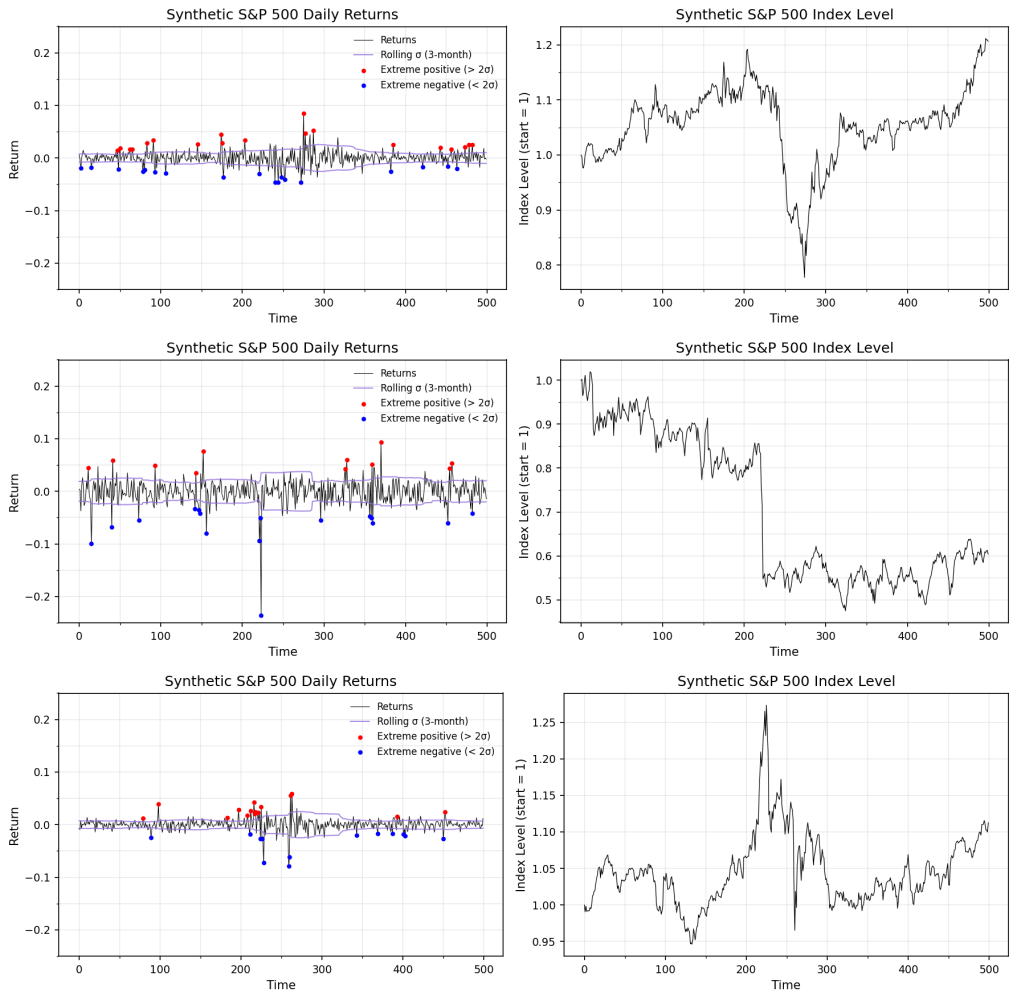
Figure 2. Three extreme scenarios generated using the Skanalytix model, shown over comparable 250-day windows. Insert the original figure unchanged.
The comparison is intended to illustrate variation in the timing, persistence and sequencing of large market movements. A synthetic scenario need not reproduce the exact trajectory of a historical crisis to be informative; its value lies in exploring other plausible configurations of extreme behaviour.
What the comparison establishes
These examples illustrate the ability to generate extreme sequences with different temporal patterns. They do not, by themselves, demonstrate that the full distribution of crisis severity or duration has been recovered, or that the model can forecast the onset of future market stress. Such claims would require additional diagnostics and out-of-sample evaluation.
There is also a fundamental limitation to what can be inferred from historical data. A model can recombine and extend patterns supported by observed market behaviour, but it cannot be assumed to capture mechanisms that are absent from the training record. For that reason, the term “black swan” is best used cautiously: a simulated extreme event is not necessarily an unprecedented or unforeseeable event in the stronger sense of that expression.
Implications for scenario analysis
Stress testing benefits from examining multiple plausible paths rather than a small collection of fixed historical episodes. Synthetic histories can complement historical analysis by varying the sequence and persistence of market movements while retaining selected features of the observed data.
The central modelling requirement is broader than generating occasional large losses. It is to reproduce the temporal structure within which those losses occur, including the persistence of elevated volatility and the concentration of extreme returns.
Conclusion
Extreme market behaviour is defined not only by the size of individual returns but also by how those returns unfold through time. The historical and synthetic scenarios considered here illustrate why the clustering and sequencing of extremes matter when evaluating plausible financial simulations.
A generative model intended for risk analysis should be assessed on these temporal properties as well as on its unconditional return distribution. Reproducing them can support the exploration of alternative stress scenarios, without implying that the next crisis can be predicted.
Adapted from “When Extremes Cluster: Generating Plausible Black Swans from Market Data”, originally published on LinkedIn in January 2026.